◆ In-browser · nothing uploaded

Overlay every module's telemetry on one axis.

Drop in your datalogs from any number of modules and see them together on one time axis. Measure, annotate, align, and scale — all parsed privately in your browser. No install, no server, nothing leaving your machine.

The demo runs on built-in sample telemetry. Buy a license to load your own logs.
overtrace.app/app
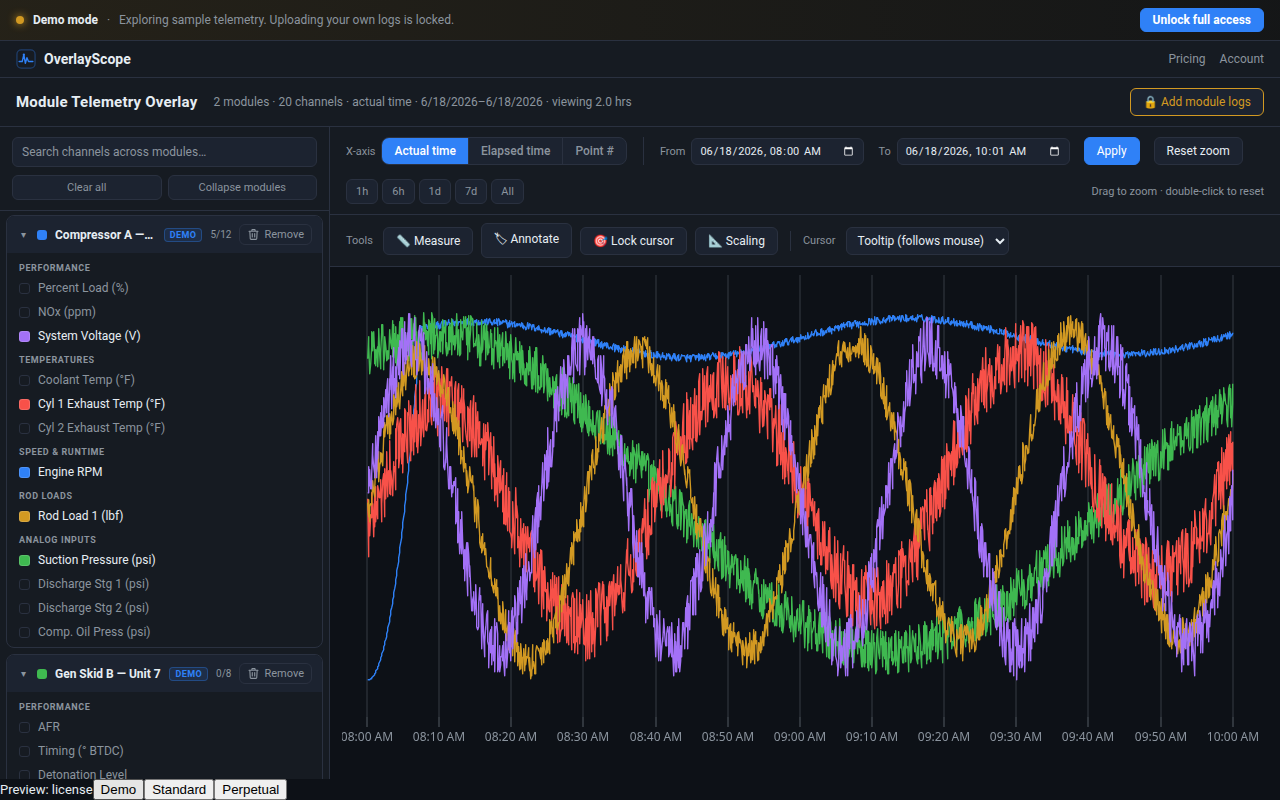
Overtrace overlaying five telemetry channels from two modules on one time axis

Built for people who want the entire picture, not just pieces

Every feature exists to answer one question faster: what actually happened, and when?

Cross-module overlay

Tick channels from any module and see them stacked on one shared time axis — compressor, skid, and ECM traces side by side.

Supported auto-detect formats

Time alignment

Nudge modules left or right in elapsed or point mode to line up the same event across logs that started at different times.

Point-to-point measure

Drop up to six points on a channel and read exact values and deltas — no more eyeballing the grid.

Annotate & lock

Mark events with draggable labels and freeze crosshair readouts at up to four spots for comparison.

Per-channel scaling

Auto or manual Y-axis range per channel, with left/right axis assignment, so small and large signals stay readable together.

Your data never leaves the browser

Files are parsed entirely on your machine with local JavaScript. That's not a marketing line — it's the architecture. There is no upload endpoint.

No upload endpoint

There is literally no server route that accepts your files. Parsing happens in a Web worker on your device.

Instant, offline-capable

Because it's all client-side, big logs open fast and keep working even on a spotty plant network.

Licensed per account

Your license is tied to your account, not a fragile hardware lock — use it on the desktop, the laptop, and the field tablet.

Try it now, buy when it earns its keep

Open the app and play with real sample telemetry — measure tools, overlays, alignment, the works. Want to try it on your own logs first? A 24-hour pass gives you full Pro access, no card. After that, Starter and Pro keep your uploads unlocked for as long as your subscription runs — or buy Pro Perpetual once and skip renewals entirely.

Frequently asked questions

Everything field engineers and shop techs ask before their first overlay.

What is Overtrace?

Overtrace is a browser-based industrial telemetry overlay tool. You load datalogs from multiple modules — compressors, gen skids, engine ECMs — and overlay every channel on one shared time axis, so you can see what actually happened, and when, across the whole system at once.

Which datalog formats does Overtrace support?

Overtrace auto-detects Emit (Dynamic Controls), Caterpillar, Waukesha, and Excel datalogs, with more formats on the way. Drop the files in and the channels are parsed and plotted automatically — no manual column mapping.

Is my telemetry data uploaded to a server?

No. All parsing happens entirely in your browser using local JavaScript in a Web worker. There is literally no upload endpoint — your datalogs never leave your machine. That privacy-by-architecture is a core part of the design, not a marketing line.

Do I need to install anything?

No install required. Overtrace runs in any modern browser on desktop, laptop, or field tablet, and keeps working even on a spotty plant network because everything is client-side.

Can I try Overtrace before buying?

Yes, two ways. The demo runs on built-in sample telemetry, so you can try the measure tools, overlays, and alignment for free. And a 24-hour trial pass — just an email, no card — gives you full Pro access on your own logs, so you are trying the top plan rather than a cut-down version. Either way your license is tied to your account rather than a single device: use it on the desktop, the laptop, and the field tablet.

How does Overtrace compare to industrial historians like PI or Timebase?

Overtrace is priced well below heavyweight historians and needs no servers, agents, or IT project to stand up. It's a fast, focused tool for overlaying and comparing datalogs after the fact — obviously worth it if it saves you an afternoon of fighting with logs, without the cost and complexity of a full data platform.